About timelines

Contents
TimeMap contains two views that you can work in when charting your timeline. Both views display the current Fact Count and Fact Density at the bottom of the timeline.
Timeline view displays your charted visual as you would present it to an audience. Timeline view is also the view that is printed. Timeline view displays fact boxes, text boxes, and the time scale as well as any added pictures or clip art.
Timeline view includes four viewing options:
The status bar in the bottom left corner of TimeMap provides buttons to increase/decrease timeline pages, view or change the current page count, resize the timeline view options, access Full Screen mode, track the current Fact Count and Fact Density for the timeline.
|

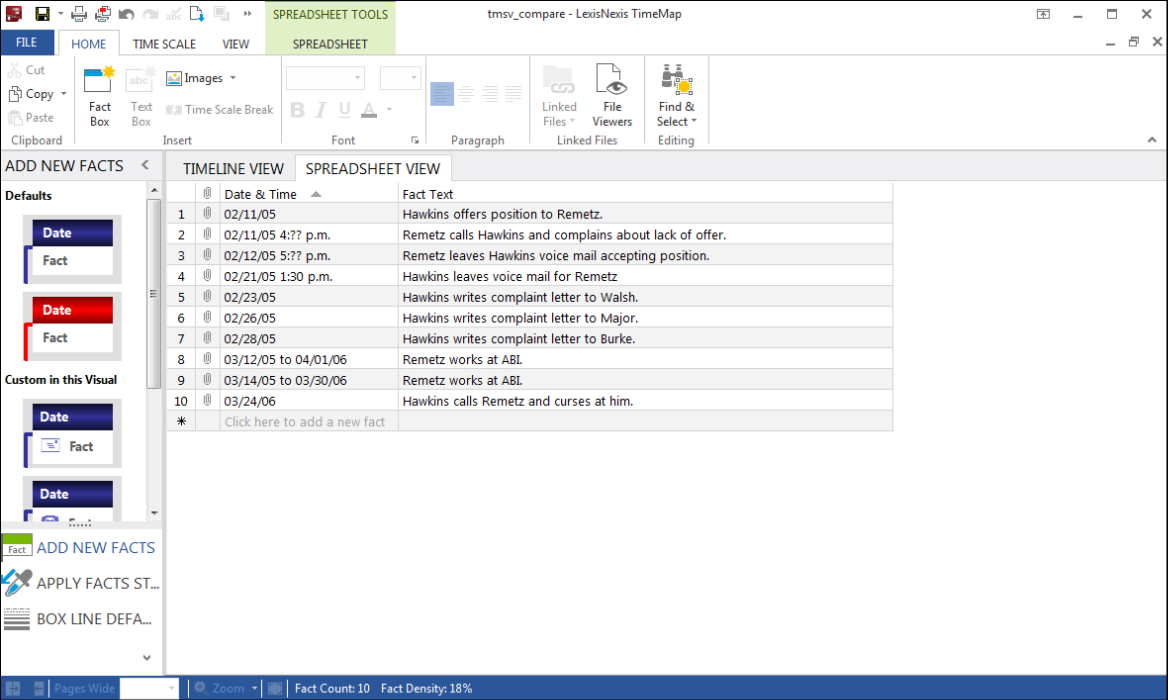
TimeMap's Spreadsheet view allows you to enter new fact data in a format that is similar to working in Microsoft® Excel. At a glance, you can see which facts have linked files, select multiple rows or specific rows for deletion or style editing, and add new facts by typing them in at the bottom of the spreadsheet.
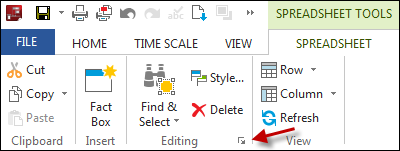
To sort facts into chronological order, press F5 or click Refresh on the Spreadsheet Tools ribbon. You can also sort the spreadsheet by clicking on the Date & Time (default sort) or Fact Text column headers. To open a linked file, click the paperclip icon next to the left of the fact. Text boxes do not display in Spreadsheet view. You can still edit timeline element properties while working in Spreadsheet view. Right-click on a fact row and click Properties. You can also select a fact and click the arrow in the Editing tool on the Spreadsheet Tools ribbon.
You can copy and paste facts from an Excel spreadsheet or .csv file where the first column is the date and the second column is the fact text. Just select the rows and copy them to your clipboard, then paste them into TimeMap. When pasting them in Spreadsheet view, remember to select both cells and not just a single cell. |