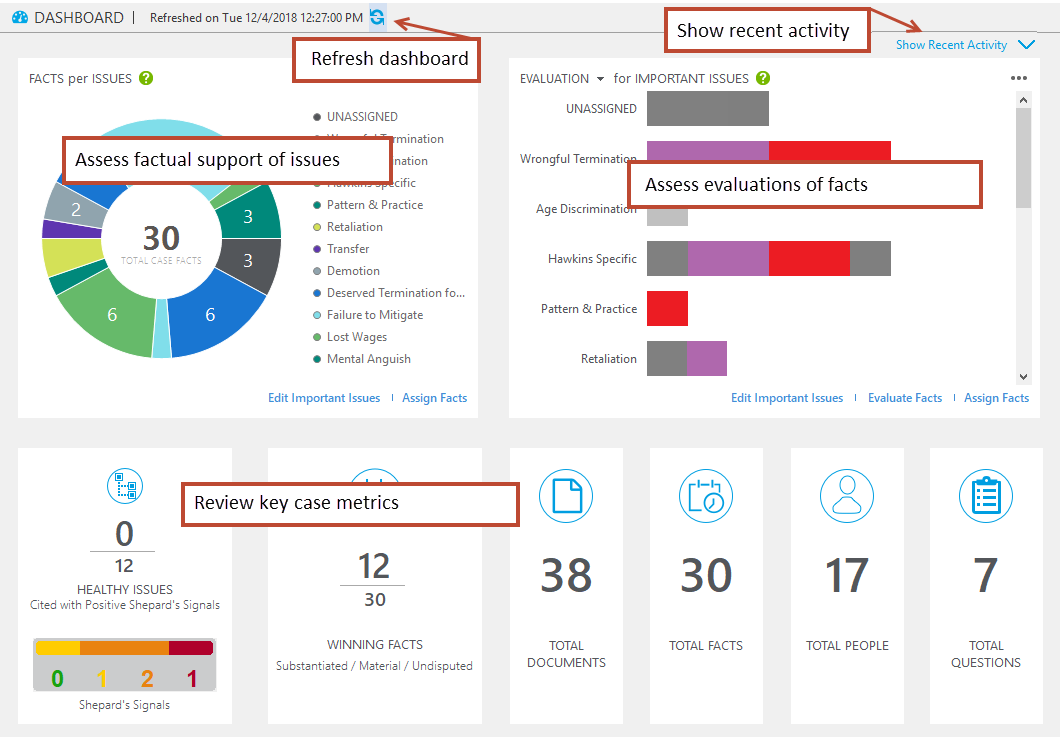
You can quickly assess the overall health of a case by using the Facts Dashboard. Its displays are divided into these areas:

These are the ways you can use the Fact Dashboard to assess your case:
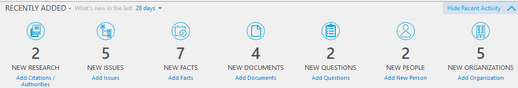
| • | Review recent case activity. To see recently added research, issues, facts, documents and more, expand the RECENT ACTIVITY panel. |
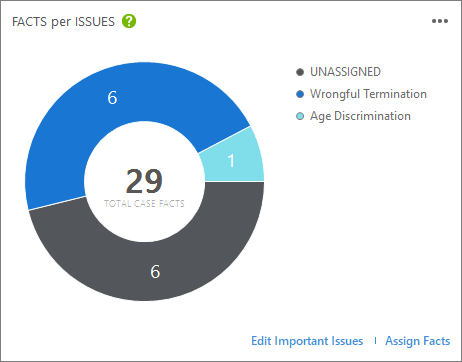
| • | Assess factual support of issues. Refer to the FACTS per ISSUES donut chart. This chart helps you assess case strength, expressed in how strongly the facts are tied to important issues |
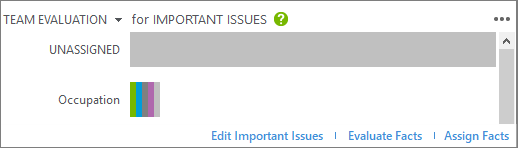
| • | Assess evaluations of facts. Refer to the EVALUATION and TEAM EVALUATION bar graphs. These help you determine whether the facts you have assigned to important issues work for or against your case. |
| • | Review key case metrics. Refer to the TOTAL counts. This area provides counts of a number of key metrics. For example, the HEALTHY ISSUES metric can give you cited with positive Shepard's Signals, along with counts of winning facts, documents, facts, people, and documents of your case. |
You can also refresh the dashboard, which is advised especially when other users are working on the case at the same time as you.
| 1. | Click Show Recent Activity. This link is located in the upper right corner of the dashboard.
The RECENTLY ADDED panel opens in the top of the dashboard. |
| 2. | Do any of the following to work with the panel: |
| • | To show counts for a different timescale, select the What's new in the last list, then select a different timescale. |
| • | To add new items, click shortcuts on the panel. |
| • | To hide the panel, click Hide Recent Activity. |
|
| 1. | On the Home tab, click Dashboard. |
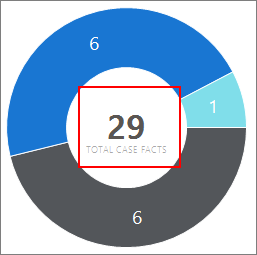
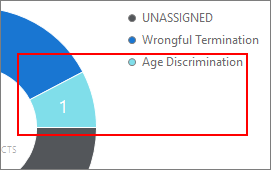
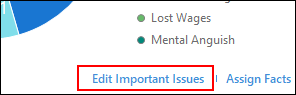
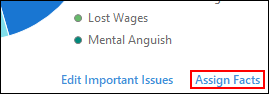
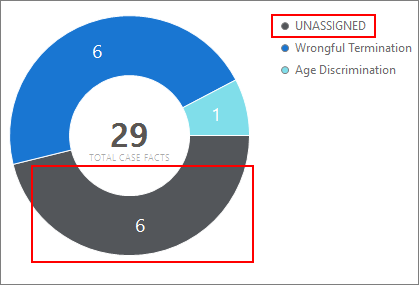
| 2. | Consult the FACTS per ISSUES (donut) chart. This chart provides a count of all facts, a breakdown of facts associated with each issue in the case marked as Important. Factual coverage of issues is evident. |

Click or point to segments of the chart to assess fact-to-issue relationship strength.
| 3. | Check the chart for the following conditions: |
|
| 1. | On the Home tab, click Dashboard. |
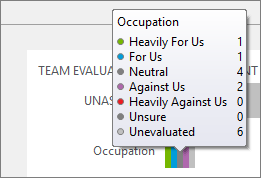
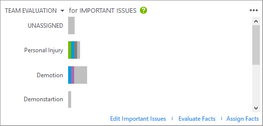
| 2. | Consult the IMPORTANT ISSUES bar charts. For each important issue in your case, this chart provides a count of facts a count, including how the facts have been evaluated as helping or hurting your case. |
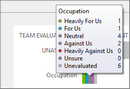
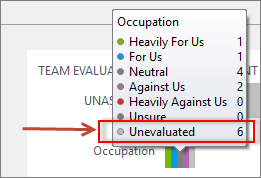
Point to bar chart segments to see a count of fact evaluations.
| 3. | Examine the bar charts to check for conditions and apply remediation, as described in the following table: |
Both the donut and bar chart provide shortcuts for opening spreadsheets and Fact Cards.
| 1. | Click the  button, which is located in the upper right corner of either the donut or bar chart area. button, which is located in the upper right corner of either the donut or bar chart area.
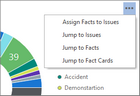 |
| 2. | Click one of the following options, depending on what you want to do: |
|
|
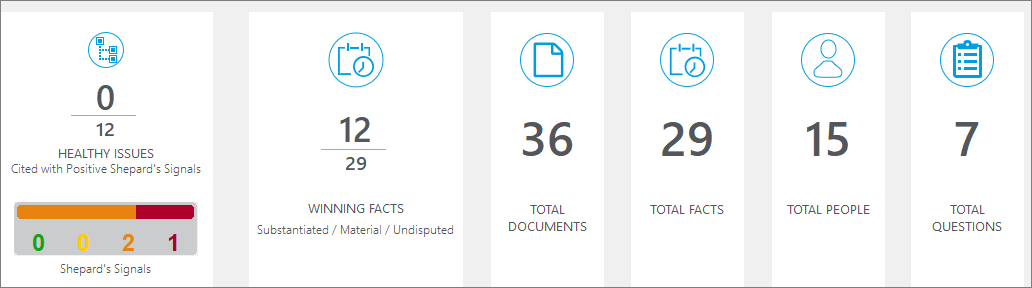
To check quick metrics for your case, review the following running counts:
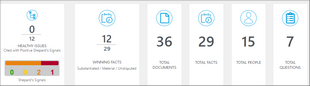
HEALTHY ISSUES. Figures are counts of issues coded by color:
| • | Green. The count of issues linked to a green Shepard's Signal indicator. Green indicates that citing references in the Shepard's Citations Service contain history or treatment that has a positive impact on your case (for example, affirmed or followed by). |
| • | Yellow. The count of issues linked to a yellow Shepard's Signal indicator. Yellow indicates that citing references in the Shepard's Citations Service contain history or treatment that may have a significant negative impact on your case (for example, limited or criticized by). |
| • | Orange. The count of issues linked to an orange Shepard's Signal indicator. Orange indicates that the citing references in the Shepard's Citations Service contain treatment that questions the continuing validity or precedential value of your case because of intervening circumstances, including judicial or legislative overruling. |
| • | Red. The count of issues linked to a red Shepard's Signal indicator. Red indicates that citing references in the Shepard's Citations Service contain strong negative history or treatment of your case (for example, overruled by or reversed). |
To review any yellow-, orange-, or red-coded Shepard's Signals, open the Research spreadsheets. On the HOME tab, expand All Shortcuts, then select Research.
WINNING FACTS. This metric provides a summary of the highest value facts in the case. The top number is the count of winning facts. A fact is defined as winning when it is marked as Substantiated, Material, and Undisputed. The lower number is a total of all case facts.
TOTAL DOCUMENTS. This is a count of all documents in the Documents spreadsheet.
TOTAL FACTS. This is a count of the total number of facts in the Facts spreadsheet.
TOTAL PEOPLE. This is a count of all people in the People spreadsheet.
TOTAL QUESTIONS. This is a count of all questions in the Questions spreadsheet.
|
Refresh the dashboard to be sure the it is displaying the most current information from the case database.
| • | Click  , the refresh button. , the refresh button.
The dashboard queries the case database and updates all displays. |
|