About CaseWide Fact Timelines

Contents
CaseWide is a bar graph representing a timeline of the facts in your case. It displays across the top of the Facts spreadsheet.
You can use CaseWide to review the facts occuring in a particular period of time. When the timeline is narrowed to show specific dates, you can double-click a bar for a specific date to open a list of facts for that date.

Each time the Facts spreadsheet is updated or refreshed, the graph is redrawn.
The CaseWide timeline reflects whatever search filters are in place and the tags applied to facts.
| • | Filtering will typically reduce the number of facts shown in the CaseWide timeline. |
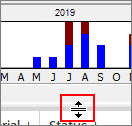
| • | Tagged facts are reflected as a stacked bar chart. The lower section is blue and represents untagged facts. The upper section is maroon and represents tagged records. |
| • | Move your mouse over the bar to view a count and percentage of untagged- versus tagged facts. |
|
You can send CaseMap facts to TimeMap® the timeline graphing tool from LexisNexis you can use to create robust timeline chronologies. In addition to creating chronologies, TimeMap provides a customizable presentation mode for use in courtroom and office presentations.
|
